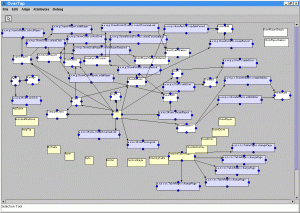
During this weekend, I’ve worked on a tool that creates diagrams from Tapestry
applications. It’s been a lot of fun, since I’ve learned how to parse java source files (with ANTLR) and I’ve refreshed my memory on XML+HTML parsing.
Well, here is an even bigger image of what I have so far.
There’s now a lot of stuff in there, and I’ll need to find a way to enhance the visuals. However, you can clearly see all the pages(white) and the components(yellow) of the app, as well as the links between them. Listeners(cyan) called from pages or components are also shown but what’s nice is that you can now see where these listeners forward.
On the tech side, I’ve continued using JHotDraw for the graphs, but have now updated to version 6.0b1 (which however is over 1 year old). I’ll probably take a look at GEF during the next weekend. I now use NekoHTML for html parsing. I decided in favor of Neko due to its license and to the fact that it exposes its services as if it were a normal SAX parser which is really handy. Finally, in order to ‘see’ what the listeners do (in the java code), I had to find a way to parse java source files. No problem there however, since I’ve found a java 1.5 grammar, and created an ANTLR parser quite easily.
Of course, the generated parser is quite generic and I had to create utility methods, such as a) find methods of file, b) find usages of parameter a in method b, e.t.c. I wonder however if there’s a library out there that does such things…
On a final note, I decided that I’ll first port this to an Intellij IDEA plugin, since IDEA users are always complaining about lack of Tapestry support.
